
Using A Solar Battery With Solar Panels & NEM 3.0 in San Diego CA
Today more than ever, it makes more financial sense to invest in a complete solar energy system with a battery storage unit.
Let’s explore why and look at an example return on investment for doing so.
The #1 most important factor of whether a solar battery system makes financial sense is your local utility’s special rate plans for their customers who installed solar energy systems and any credits they provide.
These special solar rate plans are called Net Energy Metering plans.
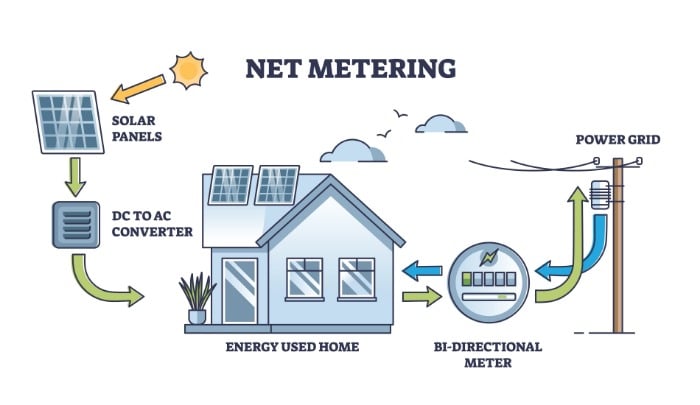
Net Energy Metering, also known as NEM, is a special program for homeowners who have solar panels.
When you have solar panels on your property, the sun helps generate electricity for your home.
Oftentimes, your solar panels make more electricity than you need, especially on sunny days or when fewer people are home using electricity.
With Net Energy Metering, instead of wasting this extra electricity, it goes to the utility company grid, SDG&E here in San Diego, where they get to sell it to your neighbors and you get credits for it.
These credits can be used later, like at night or on cloudy days, when you need more electricity from the utility company.
Net Energy Metering rates plans have evolved through the years.
The utility companies are advocates of large solar farms for themselves but aren’t big fans of losing their customers who install rooftop solar. As a result, most utility companies lobby against providing fair value credits for the excess solar electricity you send into their grid.
These NEM credits are the most crucial factor to whether a solar battery makes sense for your home or not.
The math works the opposite of how most people would think.
If the NEM credits are low, then it may make more financial sense to store that energy in a solar battery yourself than to send it to the utility grid for such low credits.
If the NEM credits are fair or high, then a battery is probably not needed and the math for a battery is unlikely to work well, because the higher credits received can offset any nighttime use purchases from the utility company.
In California, we are now in the third version of NEM, now called NEM 3.0.
NEM 1.0 started in 1996 and was very generous with credits for the electricity sent into the utility grid.
California’s Net Energy Metering (NEM) 1.0 allowed customers to sell excess solar energy back to the grid in exchange for credits from their local utility for roughly the same amount as the utility’s retail price. This created a nearly 1:1 credit exchange.
Under NEM 1.0, if you had enough space on your roof or property, solar could offset up to 100% of your electric bill.
NEM 2.0 started in 2017 and provides fair credits for the electricity your solar system sends into the utility grid but for slightly less than NEM 1.0 did.
NEM 2.0 also made utility power more expensive during peak hours and less expensive during off-peak hours.
This translates to higher net metering credits for energy sent back to the grid during peak hours.
The primary difference between NEM 1.0 and NEM 2.0 is that a small portion of the electric bill could no longer be offset by excess solar production and credits. This portion of the total rate is called “non-bypassable charges”.
NEM 3.0, which we are in now in California, started on April 14, 2023.
NEM 3.0 became a game-changer for solar.
In NEM 3.0 the utility companies fought hard to reduce the solar credits they pay to homeowners and the California Public Utilities Commission (CPUC) gave it to them.
NEM 3.0 reduces the value of solar credits by 75% or more.
Under NEM 2.0, the value of credits averaged about 30 cents per kWh, while under NEM 3.0, the value is roughly 4 to 8 cents per kWh.
The utility company then gets to sell your excess electricity to your neighbors at full retail price, usually for a profit of 10x or more.
The reduced value of credits under NEM 3.0 extends the solar-only payback period for customers who generate electricity with their renewable energy sources.
The payback period for a solar plus battery storage installation is now faster than for a solar panel only install.
FACTS FOR CURRENT EXISTING SOLAR ENERGY CUSTOMERS IN CALIFORNIA:
NEM 3.0 has NO impact on existing customers with NEM 1.0 or 2.0 agreements in place before April 14, 2023.
NEM 1.0 and 2.0 customers can add a battery backup system and still remain on NEM 2.0.
Your utility rate plan will automatically switch to NEM 3.0 twenty years after the date it was first turned on (PTO / Permission to Operate).

Under NEM 1.0 and 2.0 installing a solar battery often didn’t pencil out to be financially beneficial because the higher daytime utility credits usually offset all evening utility usage.
Under NEM 3.0 that is no longer the case. Now a solar battery makes financial sense for new solar energy systems.
Current off-peak evening electric rates from SDG&E on their Solar Time of Use (TOU DR-SES) plan charges:
- 46.6 cents per kWh Summer rates
- 43.2 cents per kWh Winter rates
So your 8 cents credit for excess daytime solar energy sent into the utility grid is no longer sufficient to offset the 43 to 46 cents you’ll be charged for evening electricity from the utility company.
Without a battery, solar customers on NEM 3.0 will be sending excess energy into the utility grid allowing the utility to sell that energy to your neighbors for up to 80 cents (peak rates) after giving you just 4 to 8 cents for it.
Basically, you’ve built a small power plant for the utility company to make money on your solar energy system.
That’s why a battery now makes sense for new NEM 3.0 customers.
It’s now wiser to store your excess energy in a battery for later use than to send it to the grid for the new low credits that don’t help very much.
When daylight ends and your solar energy system is no longer producing electricity, you’ll draw energy from the battery instead of the utility company.
Without a battery, new solar customers on NEM 3.0 can only reduce their electric bill by up to a maximum of about 50%.
With a battery storage system, new solar customers can reduce their electric bill by up to about 95%. The “non by-passable charges still apply.

Return on Investment For A Solar Battery System
Battery cost:
Two Enphase IQ-5P batteries (about 10 kWh total storage) may cost around $20,000 installed (example pricing).
Your “net cost” depends on the ownership path you choose:
Purchase / standard financing (no federal residential tax credit after 12/31/2025)
ESA / prepaid lease option (a financing partner may apply available incentives to reduce the effective cost, and you can own the system in about 5 years)
EXAMPLE:
Peak vs super off-peak delta = $0.43834/kWh
600 kWh/month shifted ⇒ $263/month extra cost ⇒ $3,156/year
So we’ll keep the same “annual peak rate cost” = $3,156 to preserve the logic.
Example A — Purchase price (no federal credit)
Battery investment (installed): $20,000
Battery lifespan (guaranteed minimum): 6,000 cycles ÷ 365 = 16.4 years
Annualized battery cost: $20,000 ÷ 16.4 = $1,220/year
Annual peak-rate savings (as shown): $3,156/year
Net annual savings: $3,156 − $1,220 = $1,936/year
ROI (page formula): ($1,936 ÷ $20,000) × 100 = 9.7% annually
Payback: $20,000 ÷ $1,936 = ~10.3 years
Example B — ESA / prepaid lease (40% lower effective cost)
If the homeowner’s effective cost is ~40% lower (example):
Effective cost: $20,000 × 0.60 = $12,000
Annualized battery cost: $12,000 ÷ 16.4 = $732/year
Net annual savings: $3,156 − $732 = $2,424/year
ROI: ($2,424 ÷ $12,000) × 100 = 20.2% annually
Payback: $12,000 ÷ $2,424 = ~5.0 years
2026 Update: The federal residential solar/battery tax credit has ended for new residential installs after 12/31/2025.
Schedule a quick call and we’ll show you the best option—purchase, financing, or ESA.
2026 Note on Incentives (San Diego Homeowners)
The federal residential solar/battery tax credit has ended, but homeowners still have smart ways to lower the net cost of solar + storage.
One popular option is our Energy Savings Agreement (ESA)—a prepaid lease-style program where a financing partner applies available incentives to reduce total cost, and you can own the system in about 5 years.
Related articles:
FREE Online Solar Design & Calculator
Solar panel monitoring service
Battery storage system fundamentals
Peak Shaving: Invest in your home’s energy future for significant ROI
How long will a solar battery last during a power blackout?
How many batteries are needed to power your home?
How many years do solar batteries last?
Solar Battery or generator for emergency backup power?
How to check if your solar panels are charging the solar battery
Why a battery makes financial sense with solar panels now under NEM 3.0
Complete Guide to Solar PPA, Lease vs Buying Solar
2026 Federal tax credit changes for solar & solar batteries
How to choose a solar installer

- Solar Battery + EV Charging Station + Solar PV = The Dream Team - April 7, 2026
- 2026 Federal Tax Credit Changes For Solar Energy Systems - July 8, 2025
- How Solar Batteries Work - March 4, 2024
